Sensationalized for seeing through the forest canopy, touted for its remarkable imagery that maps the forest floor, LiDAR* — the remarkable new laser technology that helps us “see” the unseen — has captured the attention of the public even as the Maya forest still keeps many of its secrets. The recent news of the extensive LiDAR coverage of the Reserva de la Biosfera Maya in Guatemala represents an important step in uncovering the nature of the ancient Maya landscape — revealing the topographic reality of the forest floor. But the Guatemala coverage is not the first LiDAR look into archaeology under the canopy. This publicized coverage was already matched in western Belize, first for the area associated with the ancient Maya city of Caracol in the south, over-flown in 2009, then the area of El Pilar, an ancient Maya city located on the border between Belize and Guatemala in 2012, followed by a major swath of 1057 km2 of the Belize Valley in 2013. All combined, now the LiDAR surveys of the central Maya lowlands makes for an amazing source for new research on the Maya environment and settlement. And as a resource, it is clear that the lab work in the context of the GIS and field work with the GPS to validate these data will take decades. Combining the Belize and Guatemala LiDAR coverages, we have a total area of some 3000 km2, embracing northern Guatemala and western Belize, the core area of Classic Maya civilization (Figure 1 ).
*Light Detection and Ranging, a remote sensing method that uses light in the form of a pulsed laser to measure ranges, or variable distances, to the Earth, often employed by aircraft
______________________________
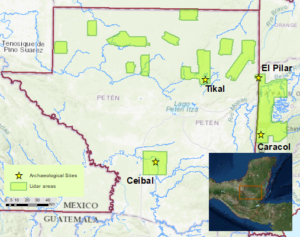
Fig. 1: Regional view of LiDAR coverage for the Maya area. BRASS/El Pilar
_______________________________
We now have the ability to identify every major Maya monument, what we call the “big stuff.” This includes a mysterious “Citadel,” the hilltop temple-plaza complex surrounded by rampart and earthworks to the east of the core of El Pilar.
The El Pilar Experience
We have been working with LiDAR coverage for four years at the El Pilar Archaeological Reserve for Maya Flora and Fauna. We find LiDAR technology to be a magnificent tool (Figure 2). The data on topography alone is astounding, and we can interpret variations in elevations to 1 m with tracking details of the ground. BUT: LiDAR is not a magic wand. There is a vital need to use ground-truth procedures and validate interpretations from LiDAR by archaeologists in the field.
______________________________
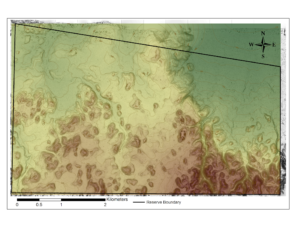
Fig. 2: El Pilar Archaeological Reserve LiDAR : Bonemap visualization with “big stuff” dramatically visible. BRASS/El Pilar
_______________________________
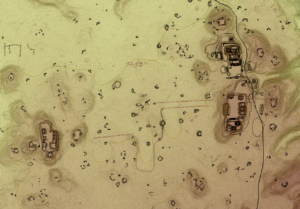
The El Pilar LiDAR coverage of a 20 km2 area straddles Belize and Guatemala (Figure 3). We initially examined the major monuments. They were startlingly clear! It is the small structures as well as related cultural features — the depressions, terraces, and quarries — that are subtle, requiring care in the relationship of the visual rendering of the LiDAR and the field mapping details. We began in the lab using the GIS and our bone-mapping visualization to identify the elements that were potentially cultural remains — we call these our “GoTo” points (Figure 4). We have field-verified our lab identifications, validating all features within a 10 km2 area. We have field-investigated the areas immediately surrounding the Late Classic core of El Pilar where we had mapped in 2000 and 2001. We have covered an area in the NE with few identified features and in the NW where there were many features. We have field-validated 1,214 points in total (Figure 5). We have found that an average of 83% of our points of interest result in cultural features on the ground, but only 611, or 50% are attributed to structures and mapped as residential units of the ancient Maya people.
_____________________________
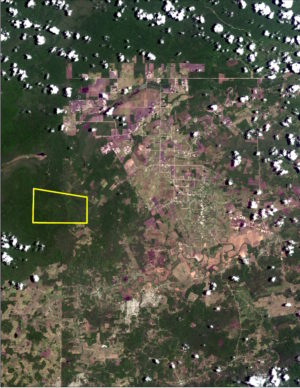
Fig. 3: Location of the El Pilar Archaeological Reserve for Maya Flora and Fauna indicated with a yellow polygon on Landsat 8 imagery. BRASS/El Pilar
____________________________
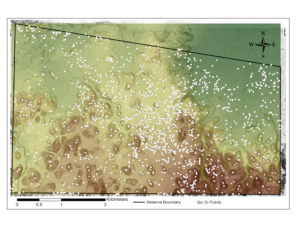
Fig. 4: El Pilar “GoTo” points for the 20 km2 survey area. BRASS/El Pilar
______________________________
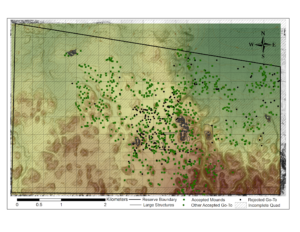
Fig. 5: The visited “GoTo” points in surveyed 10 km2 area with green = accepted and black = rejected. BRASS/El Pilar
_______________________________
There is considerable variability across space related to the way the ancient Maya used the landscape. Our predictive model shows that the Maya preferred well drained areas and our surveys at El Pilar support this. The NE area of the El Pilar Archaeological Reserve is a transitional wetland. There, we tabulated very few elements: less than 20/km2. Our question was: Does this lab review in the context of the GIS square with our field investigations? With so few targets for our “GoTo” points, we determined that this area warranted a full coverage survey to test the accuracy of the LiDAR.
In 2016, we were able to verify the truth of the LiDAR imagery in the field by validating the few cultural remains in the area. We recorded 106 features, including 80 residential units. This result gave us confidence in our expectations and in the LiDAR visualizations. The majority of the sites were located in the higher southern portion of the survey. This area rises out of the wetlands and is near Chorro, a minor center not far from El Pilar. Many of our “GoTo” points we started with in this area were rejected, attributed to the debris of nuts and dead fronds that accumulate beneath the magnificent Atelea cohune palms. We found some unusual linear features based on our field survey in the wetland zones that were not visible in LiDAR visualizations. As unusual alignments, these features along contours are perhaps related to water control. But such features, while not domestic architecture, could be something else.
In the visualization of the NW area of the reserve, we identified many large rectangular features in the LiDAR images. There were approximately 60 “GoTo” points per km2, three times the number of the NE area. Most of these points revealed major cultural features, and along the way we mapped quarries, depressions, terraces, berms, and chultunes, that are not reliably visible with the LiDAR but are important land use features. We mapped 150 residential units in the 2017 survey, nearly twice as many as the NE area. We found that few of our points were rejected as natural features compared to the NE. Most common natural features were large tree buttresses, like the amate trees.
____________________________
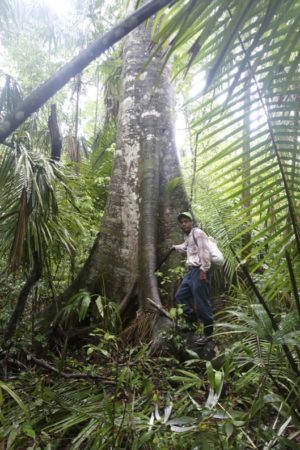
Fig. 6: Buttressed amate tree with Jerry Waight as scale. BRASS/El Pilar
____________________________
We expected major architectural features based on the LiDAR, and we were not disappointed. We mapped large plazas, over 100 m in length, temples higher than 11 m, even platforms over 25 m long. We noted that the major architecture followed ridges that flanked an arroyo. By the conclusion of the survey, three monumental areas were mapped among the residential units. These minor centers were located within 2 km of the El Pilar core. We named them: OxTeXik, east of the arroyo; Amatal, west of the arroyo; and Kum, to the north.
The Significance of the El Pilar Surveys
We have learned much about the relationship between the landscape and the LiDAR-based visualization over the course of our four years of field validation. It is important that we have collected data on the visualizations and the validation of cultural features. Although not all suspicious features are accepted in the field, LiDAR is a great tool for directing the “boots on the ground.”
We are now dedicated to the long process of learning how the vast potential of LiDAR can be integrated into our archaeological tool kit. Clearly an asset, LiDAR increases our capacity to understand the importance of the landscape and in interpreting settlement patterns. We now can hypothesize specifically on the nature of ancient land use. We can also appreciate the variability in the types of cultural features revealed by laser technology. This applies both to archaeology generally and the Maya, specifically.
Revealing the Geography
While we are absorbing new aspects about archaeological discovery, we are able to identify the geographic foundation of the surface of the Maya forest as well as distinctions in the forest. The LiDAR coverage allows us to recognize the geography, the ridges and lowlands, the hills and drainage, as well as the water flows. We have to bear in mind that at least 95% of the laser returns collected by the LiDAR technology is attributed to above ground biomass. These data, when used by forest ecologists and resource managers, provide direct information on the state of the forest, its varied heights and relationship to the topography. In fact, with cross sections of the LiDAR point cloud, one can identify actual trees! The forest environmental variability is the key to interpreting ancient Maya settlement, and the density of settlement is the key to understanding the extent of ancient civic centers.
The Takeaways
Comprehending the potential of LiDAR for archaeology in the tropics will be a long process. LiDAR coverage comes with massive amounts of data (Figure7). There is an average of 25 laser returns per m2. This translates into 25,000,000 returns per 1 km2 and these digital data take up a lot of space and are hard to manipulate with the average computer.
______________________________

Fig. 7: Oblique LiDAR view of the El Pilar acropolis and ground points (dark green) and vegetation biomass (light green). BRASS/El Pilar
_______________________________
When contemplating the data sets generated by the reported 1200 km2 coverage in Guatemala, the numbers are astonishing! Thinking that only 5% of the returns are the last returns and are taken to be the ground surface, those numbers come to 1,250,000 per km2! These are the data that we must work with as our starting point. This is before any ground validation is initiated in the field. The reported claims of 60,000 structures, around 30-50 structures/km2, are not startling based on all the traditional settlement transect surveys that reveal dense settlements where there are well drained uplands.**
Ground-truthing in the field is not simply inputing the destination points into the GPS and trekking out to them. Each GPS can record tracks as you course to the destination. In the field, archaeologists record way points with the GPS and they need to be properly identified. Managing all these facets of data collection is a job unto itself. Fundamental data collection protocols must be established. Without a defined protocol, these data quickly become unwieldy. Huge amounts of data are generated from LiDAR lab-to-field projects and care must be taken to ensure their legitimacy.
We have developed and honed our El Pilar protocol for field validating the “GoTo” points generated in the lab, where points are identified on LiDAR visualizations in the context of GIS. Using our Bone mapping visualization strategy, we identify features on the landscape as our field mapping destinations. For the past four years, we have covered 10 km2, validating 1,214 “GoTo” points, mapping 1,335 new cultural features, verifying 611 domestic structures, and mapping 7 civic monumental locales. While visiting our “GoTo” points, we found 16% were not cultural, but natural elements: buttresses of large trees, frond and seed debris from palms, and even “pox” we confirmed as problems inherent in the LiDAR data interpretations. We use our findings with a strict protocol of field-to-lab management. With our experience, we are now in a position to untangle the potentials and the predictions based on LiDAR.
Going Forward
Our confidence in LiDAR grows with our boots on the ground. Our experience is providing a new way of appreciating the nature of the Maya forest and the importance of understanding archaeology under the canopy. Our new Maya Forest Atlas provides one with a unique view of scale, featuring our El Pilar LiDAR at the site scale, geographic data at the local scale of the Belize River, and regional scale views of the entire Maya forest. These data will be updated as we work to complete the validation for the remaining 10 km2 of the El Pilar Archaeological Reserve for Maya Flora and Fauna.
LiDAR is no magic wand. Yet our survey efforts are well informed and greatly advantaged by the technological contribution of LiDAR. We know there is much work to do and we can see that our work at El Pilar will be a solid basis for the hard work that Maya archaeological surveyors will be undertaking into the future.
_____________________________
*Light Detection and Ranging, a remote sensing method that uses light in the form of a pulsed laser to measure ranges, or variable distances, to the Earth, often employed by aircraft
**The Maya Forest Garden: Eight Millennia of Sustainable Cultivation of the Tropical Woodlands by Anabel Ford and Ronald Nigh
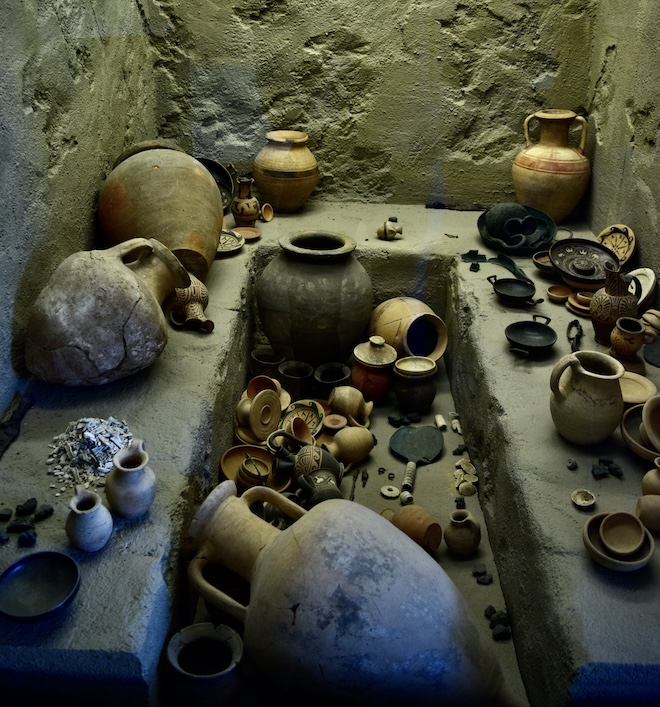
Article Cover Image: Architecture revealed in the El Pilar area with the help of LiDAR. BRASS/El Pilar